How to debug your .NET applications and packages without the actual source
Debugging is a big part of a developer’s job. It becomes even more critical when things don’t happen quite right in production. If you are lucky, your production application has been compiled with the symbols (PDBs or Program Database). Since I always tend to forget how to debug in such a way, I am writing it here as reminder to myself, but also to remind you that the world does not stop here if you did not compile the pdbs with your production application. To be able to debug, a copy of Visual Studio is needed.
Debugging a .NET application when the source code is unavailable
Debugging an application when the source is unavailable can now be done with tools like jetBrains dotPeek. dotPeek is a .NET decompiler. It can decompile any .NET binaries/DLLs.
The first step is to open dotPeek
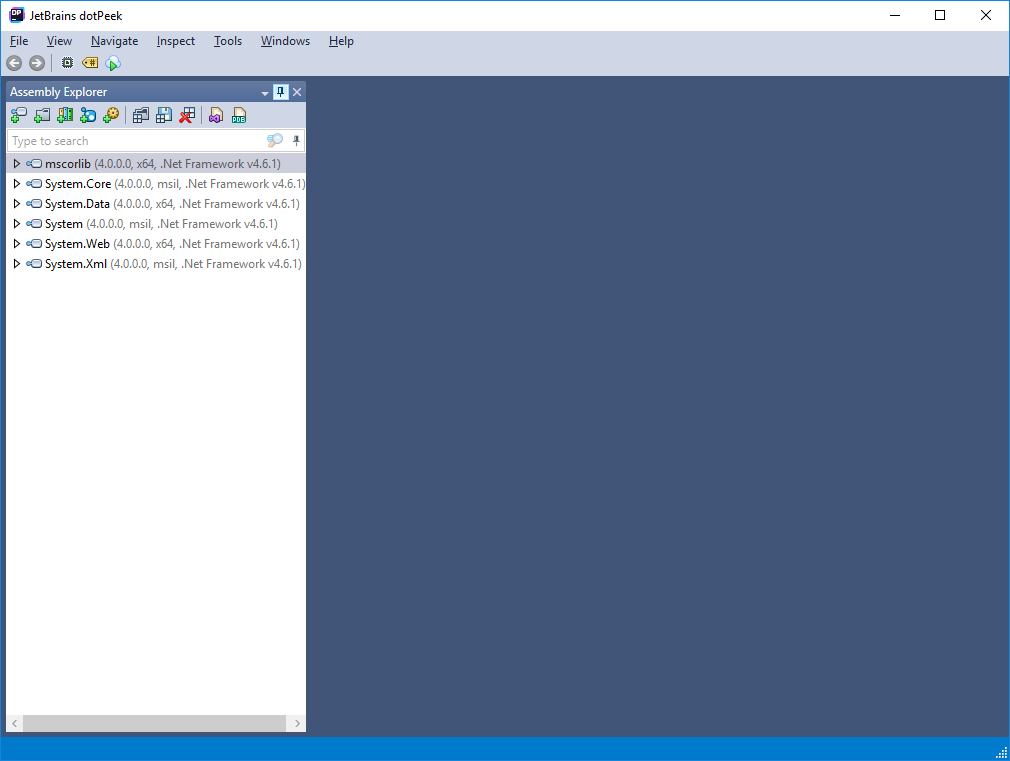
Go into the Tools menu and select Symbol Server.
Upon the first time use, dotPeek will ask you which assemblies do you want to decompile (create the pdbs for). Select the option that suits you. I chose Assemblies opened in Assembly Explorer.
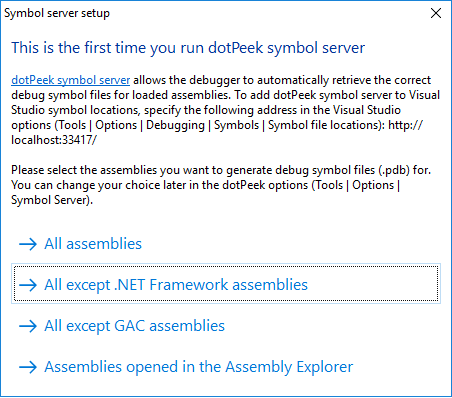
Once you selected which assemblies to decompile, a symbol server is now available at http://localhost:33417
For simplicity of this post, I created a simple .NET Core console application. I will generate an unhandled exception, which will terminate the application.
To setup the symbols in Visual Studio, go to Tools -> Options -> Debugging -> Symbols -> Symbol file locations
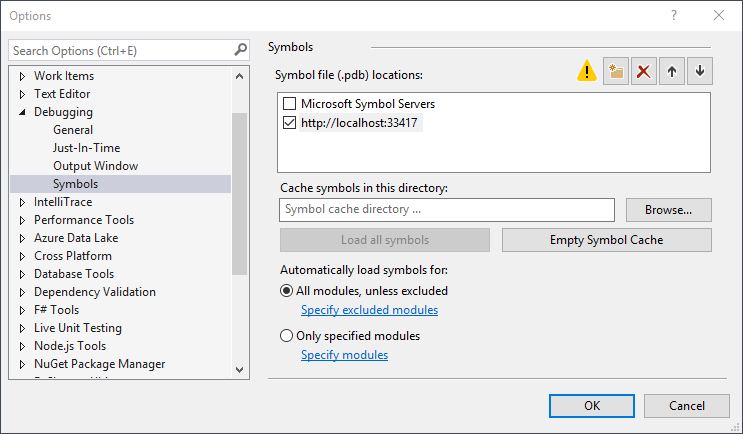
Make sure to also disable Just My Code in the debugging section (Tools -> Options -> Debugging -> General)
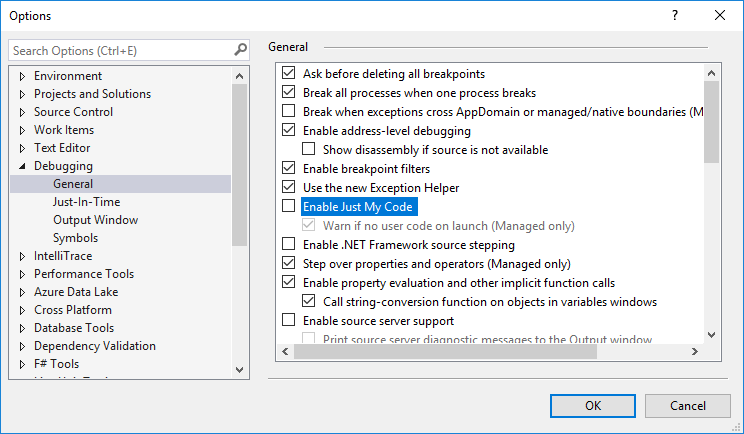
It can useful to disable the option Require source files to exactly match the original version. This can happen if the process executable does not match exactly the source.
Once this is done, you can attach your process that you want to debug. In my case, I attached the spawned process from the command line (dotnet) since my application is a console application.
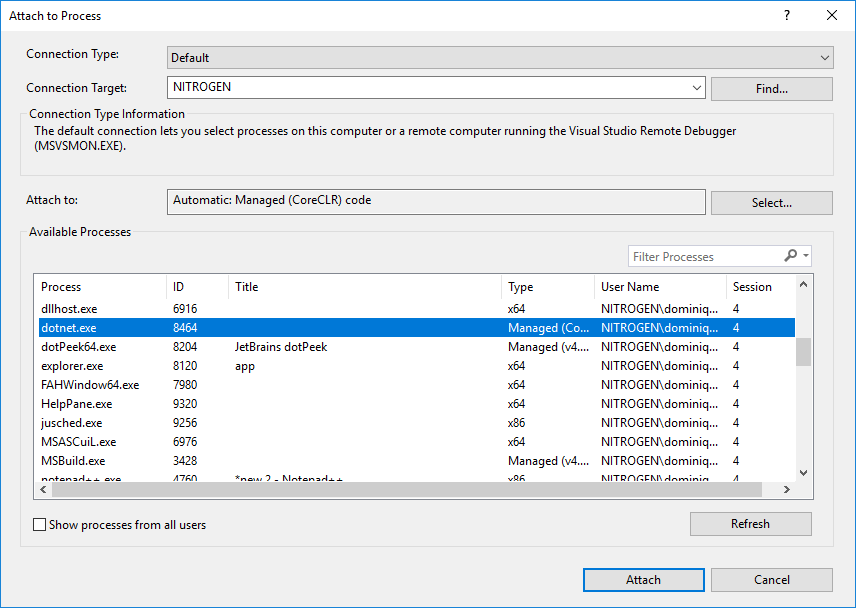
Set a breakpoint where you want the Debugger to stop. In my scenario, I set it on the Main entry method, a little after the input has been entered
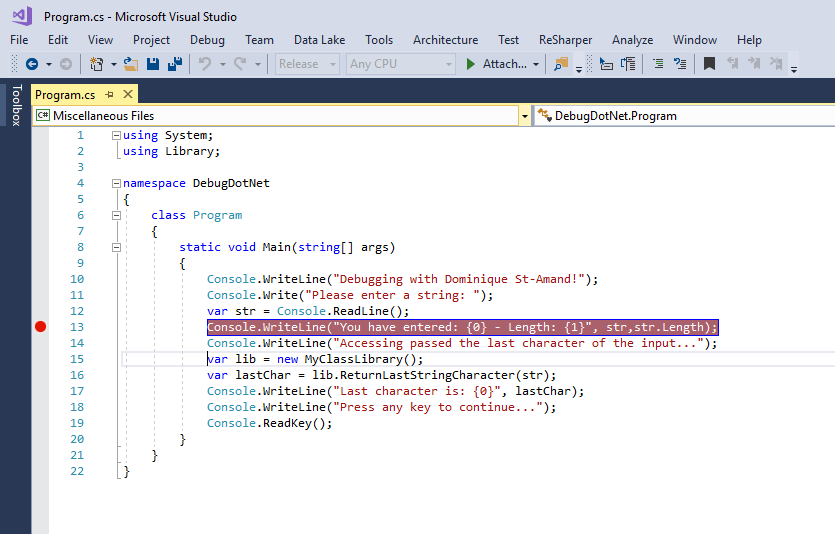
Interact with your application until the breakpoint is hit. Then you can debug your application as usual. Here is the full process in a short video.
UPDATE (2017-08-11)
I came across an article that jetBrains published where they used dotPeek to debug a crash dump (useful when analyzing crashes like in iis). It can also be useful to know how to do that as its described in the article.
Debugging a NuGet package
SymbolSource has a post describing the process. To help you out, I took out the except that shows you how to do it
Recommended configuration
To configure Visual Studio for symbol/server use, follow these instructions:
- Go to Tools -> Options -> Debugger -> General.
- Uncheck “Enable Just My Code (Managed only)”.
- Uncheck “Enable .NET Framework source stepping”. Yes, it is misleading, but if you don’t, then Visual Studio will ignore your custom server order (see further on).
- Check “Enable source server support”.
- Uncheck “Require source files to exactly match the original version”
- Go to Tools -> Options -> Debugger -> Symbols.
- Select a folder for the local symbol/source cache.
- Add symbol servers under “Symbol file (.pdb) locations”. Pay attention to the correct order, because some servers may contain symbols for the same binaries: with or without sources. We recommend the following setup:
http://referencesource.microsoft.com/symbolshttp://srv.symbolsource.org/pdb/Publicor the authenticated variant (see above)http://srv.symbolsource.org/pdb/MyGetor the authenticated variant (see above)- (other symbol servers with sources)
http://msdl.microsoft.com/download/symbols- (other symbol servers without sources)
You can then after setting up the symbol servers, debug your application as your normally do.
I hope this post can be helpful in debugging your applications and NuGet packages! Leave your comments below if you have other tips and tricks that can be useful. I will be more than happy to edit my post to include them.
